Author’s note: These articles were written for the “original” step system, not the revisions introduced in Third Edition.
This is fourth in a series of articles that examines the Step System. In this final installment, we look at an often overlooked, but equally important part of the Earthdawn engine.
The Results Table
Where do all those numbers come from?
So much emphasis is placed on the Step Table, and the statistical deviations that appear at certain points within it, that the Results Table gets overlooked. While there seems to be some kind of sense to the numbers assigned to different result levels, the pattern isn’t obvious or easily calculable.
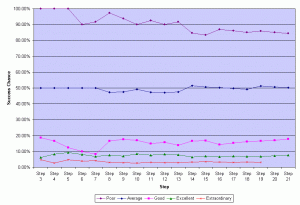
If we calculate the chance of success for each step, looking at where the break point for each Result Level falls on that Step (using the Step Number as the Average result) uncovers an interesting trend.
Here are some break points for various steps.
| Result Level | Step 5 | Step 8 | Step 11 | Step 14 | Step 17 | Step 20 |
| Poor | N/A | 97.22% | 92.50% | 84.69% | 86.00% | 85.13% |
| Average | 50.00% | 47.22% | 47.34% | 51.48% | 49.75% | 50.64% |
| Good | 12.50% | 16.67% | 15.00% | 16.65% | 15.27% | 17.10% |
| Excellent | 9.38% | 7.64% | 7.59% | 6.41% | 7.12% | 7.29% |
| Extraordinary | 4.69% | 3.01% | 3.05% | 3.33% | 3.09% | 2.96% |
You may see the trend, but to better illustrate the pattern take a look at the graph to the right. (As always, click on the picture for a large version.)
The numbers on the Results Table are based on the chance of rolling certain results or better, using the Step Number as the base Difficulty Number. If we crunch the numbers, we find that these chances are approximately:
Poor: 85% Average: 50% Good: 15% Excellent: 7% Extraordinary: 3%
As you can see in the graph, some of the lower Step Numbers do not fall as closely to these averages as later Steps do, primarily because there is such a wide variance between the chance of individual values. Still, the statistics demonstrate—as they have throughout this series—that there is a solid mathematical base to the system.
But what does it mean?
If you’ll recall from our previous article, we discussed the changes that happened in the probability curves if we changed Step 14 from d20+d4 to 2d12. If you decide to adopt this change for your game, you should (ideally) adjust the result levels for Difficulty Number 14 to fit the curve generated by the different dice.
The probability table for 2d12 is:
| 2 | 99.31% | 13 | 54.17% | 24 | 9.61% | ||
| 3 | 99.31% | 14 | 47.22% | 25 | 8.33% | ||
| 4 | 97.92% | 15 | 40.86% | 26 | 7.18% | ||
| 5 | 95.83% | 16 | 35.07% | 27 | 6.12% | ||
| 6 | 93.06% | 17 | 29.86% | 28 | 5.16% | ||
| 7 | 89.58% | 18 | 25.23% | 29 | 4.31% | ||
| 8 | 85.42% | 19 | 21.18% | 30 | 3.56% | ||
| 9 | 80.56% | 20 | 17.71% | 31 | 2.91% | ||
| 10 | 75.00% | 21 | 14.81% | 32 | 2.36% | ||
| 11 | 68.75% | 22 | 12.50% | 33 | 1.91% | ||
| 12 | 61.81% | 23 | 10.76% | 34 | 1.56% |
Looking at these values, we can see that instead of the Result Levels given on the table (7/14/21/26/32), we should change the Poor and Extraordinary results to 8 and 31, respectively.
Of course, you may feel that this is a minor change and will not greatly affect play. This is (as always) up to you. However, an understanding of the design principles that form the foundation of the system could be valuable if (as some have done) you choose to make greater modifications to the system.
Conclusion
I hope these articles have opened your eyes to what I feel are the hidden beauties of the Step System. As we have seen, there are strong mathematical foundations to the engine of the Earthdawn game, and reasons—even if those reasons are not immediately obvious—for the dice progression the system uses.

