Author’s note: These articles were written for the “original” step system, not the revisions introduced in Third Edition.
This is the second in a series of articles that examines the Step System, the engine under the hood of the Earthdawn game. In this installment, we look at the range of two-dice steps and the shape of their probability curves.
You can read the first article in this series here.
The Two-Dice Steps
While the calculations for single-die steps are relatively simple, adding another die into the mix makes the process a little bit more involved because of the possibility that either die (or both dice) might result in bonus dice.
Before we get into that however, let’s look at a two-dice probability calculation without bonus dice. The possible results for a ‘normal’ roll of 2d6 are:
Result Die Faces
2 1-1
3 1-2, 2-1
4 1-3, 2-2, 3-1
5 1-4, 2-3, 3-2, 4-1
6 1-5, 2-4, 3-3, 4-2, 5-1
7 1-6, 2-5, 3-4, 4-3, 5-2, 6-1
8 2-6, 3-5, 4-4, 5-3, 6-2
9 3-6, 4-5, 5-4, 6-3
10 4-6, 5-5, 6-4
11 5-6, 6-5
12 6-6
There are a total of 36 possible results. To calculate the chance of success for any given result, we simply count up how many results in this set succeed.
Example: There are 26 successful rolls for a target of 6 or better (marked in green in the chart). This makes the chance of success
26/36 = 0.722 (or 72.2%)
At this point we aren’t looking at anything more complicated than we saw with the single-die Steps. Let’s look at that distribution again, focusing on the places where one (or both) of the dice might result in bonus dice.
Result Die Faces
2 1-1
3 1-2, 2-1
4 1-3, 2-2, 3-1
5 1-4, 2-3, 3-2, 4-1
6 1-5, 2-4, 3-3, 4-2, 5-1
7 1-6, 2-5, 3-4, 4-3, 5-2, 6-1
8 2-6, 3-5, 4-4, 5-3, 6-2
9 3-6, 4-5, 5-4, 6-3
10 4-6, 5-5, 6-4
11 5-6, 6-5
12 6-6
In each of the red pairs, one of the dice is rerolled as a bonus die. In the blue pair, both dice are rerolled. Let’s see how we factor these into our calculations by looking at the chance of success for a couple of different difficulty numbers.
Example: For a difficulty number of 8, there are 15 basic results that equal or beat the difficulty number, giving a base probability of
15/36 = 0.417 (or 41.7%)
We then need to add in the chance of bonus die combinations that also succeed at the test. There are two results that are not included in the base probability—the 1-6 and 6-1 combinations. The minimum result needed on the bonus die for each of these combinations is 1. On a d6 (the bonus die being rolled) the chance of rolling a 1 or better is 100% (or 1). This gives us:
2/36 (number of combinations with bonus dice) x 1 (chance of success on bonus dice)
or simply, 2/36. Adding this to our base probability from above, we get
15/36 + 2/36 = 17/36 = 0.472 (or 47.2%)
You may notice that the chance of success for a difficulty number of 8 on a Step 8 isn’t quite 50%. We’ll explore this in a moment. First, let’s look at another example.
Example: For a Difficulty number of 15, there are no basic combinations that equal or exceed 15, so our base probability is zero.
Now let’s factor in the bonus die combinations. There is one combination with two bonus dice (6-6), totaling 12 (1/36 chance). A roll totaling 3 or higher on the bonus dice will succeed, bringing the total to 15. The chance of rolling 3 or better on 2d6 is 35/36. The final chance of success for this particular combination is the product of those two terms
(1/36) x (35/36) = 0.027 (or 2.7%)
We now need to add in the chance of the other bonus die combinations. We have two combinations (5-6 and 6-5) where we need a result of 4 or better on the bonus die (a 3/6 chance on a d6), two combinations (4-6 and 6-4) that need a result of 5 or better (a 2/6 chance on a d6), and so on. Each of these combinations get added into the total chance of success
(2/36) x (3/6) + (2/36) x (2/6) + (2/36) x (1/6) + (2/36) x (1/6) + (2/36) x (5/36)
A little bit of arithmetic can simplify this down, and adding it in gives us the total probability
(35/362) + (3/6 + 2/6 + 1/6 + 1/6 + 5/36)/18 = 0.0995 (or 9.95%)
A spreadsheet program can get really handy at this point. Aside from easily crunching the numbers, the chance of bonus dice rolling certain results is calculated in lower steps, and you can build those references into the formulas, making the process much smoother once you notice the patterns.
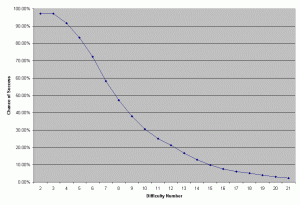
If we calculate the chance of success for a series of difficulty numbers with Step 8, we get the following data table
|
DN |
Chance of Success |
DN |
Chance of Success |
|
|
2 |
97.22% |
12 |
21.30% |
|
|
3 |
97.22% |
13 |
16.67% |
|
|
4 |
91.67% |
14 |
12.96% |
|
|
5 |
83.33% |
15 |
9.95% |
|
|
6 |
72.22% |
16 |
7.64% |
|
|
7 |
58.33% |
17 |
6.02% |
|
|
8 |
47.22% |
18 |
5.09% |
|
|
9 |
37.96% |
19 |
3.94% |
|
|
10 |
30.56% |
20 |
3.01% |
|
|
11 |
25.00% |
21 |
2.26% |
This data generates the probability curve to the right. (As always, click the graph for a larger view.)
There are a couple of details I’d like to point out. First of all, notice that the chance of success is the same for difficulty numbers 2 and 3. While the minimum result on 2d6 is 2 (and would normally result in a 100% chance of success), the Rule of One states a result of all ones on the dice is counted as a failure, even if the total would otherwise succeed.
Second, let’s talk about the ‘average’ result of Step 8. As you can see from the data, there is no result with a true 50% chance of success. The 50% mark falls between the results of 7 (58.33%) and 8 (47.22%). The latter is closer to 50%, so it is the average result of the roll—the true average falls somewhere around 7.8, but since fractional results aren’t possible, we need to use the closest value. This is the case for all of the multiple-die steps—the chance approaches 50%, but never quite gets there.
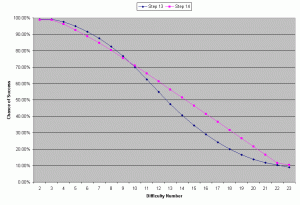
 The two-die steps all show the same basic curve for the probability distributions—a rounded curve that starts off relatively level, drops off, and then levels off at the tail end. How quickly the curve drops off depends on how close the dice in the step are to each other. The lower range (Steps 8 through 13) shows a more traditional ‘bell curve’, while the higher range (Steps 14 through 18) looks more linear. This is most obvious when you compare Step 13 to Step 14, which you can see to the left.
This comparative graph leads into the next installment of the series, which examines the age-old debate of “d20+d4 or 2d12”.

